Top
Top Site Map
 References
 Link
Link About Me
 日本語サイト
Current Silver Price
Silver is a commodity that is traded 24 hours a day in the world’s market centers – London, Zurich, New York, Chicago and Hong Kong.
The London market started trading in the 17th century, and it – like other major markets – provides a vehicle for those who wish to trade in physical silver on a spot basis, or on a forward basis for hedging purposes. The London market has a "fix" which offers the chance to buy or sell silver at a single price. The fix begins at 12:15 p.m. and is a balancing exercise; the price is fixed at the point at which all the members of the "Fixing" can balance their own, plus clients’, buying and selling orders.
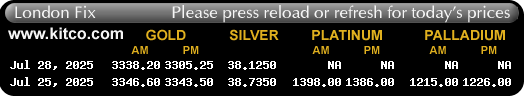
Although London remains the true center of the physical silver trade for most of the world, the most significant paper contracts trading market for silver in the United States is the COMEX division of the New York Mercantile Exchange. Spot prices for silver are determined by levels prevailing at the COMEX; and although there is no equivalent to the London fix, Handy & Harman, a precious metals company, also publishes a price at noon each working day. Here is a real time chart of New York spot price (24 hour $US Dollar price per ounce).
![[Most Recent Quotes from www.kitco.com]](http://www.kitconet.com/images/live/s_silv.gif)
![[Most Recent Quotes from www.kitco.com]](http://www.kitconet.com/images/live/s_gold.gif)
To view silver price data tables from other sources please select one of the links below.
Current Prices
Monthly Prices (1996-2010)
- COMEX Spot Price
- London Fix — Monthly Prices
Historical Prices (1975-2009)
- COMEX Spot
- London Fix
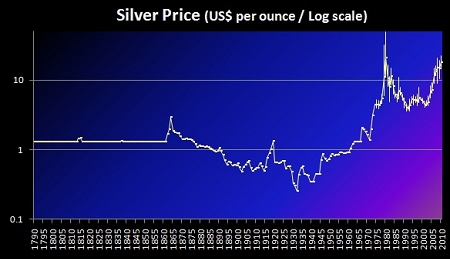
History of Silver Price
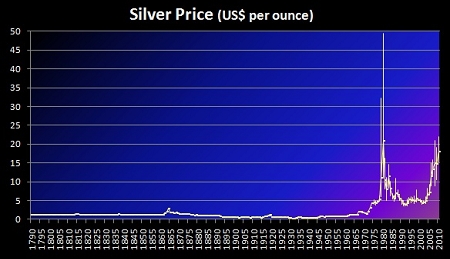
A primary factor affecting the price of silver is the available supply versus fabrication demand. In recent years, fabrication demand has greatly outpaced mine production forcing market participants to draw down existing stocks to meet demand. As these available sources continue to decline, silver's fundamentals continue to strengthen. However, since silver is a tangible asset, and is recognized as a store of value, its price can also be affected by changes in things such as inflation (real or perceived), changing values of paper currencies, and fluctuations in deficits and interest rates, to name a few.
In order to fully understand how silver came to be where it is today, and where it might be going, it is useful to review silver market trends since 18th century. By looking at the larger trends that have swept silver supply, demand, and prices upward and downward since 18th century, a much fuller understanding emerges of where silver stands today.
 To read about the evolution of the silver market from 1950 through present click here.
2000 to Present
1990 to 1999
1981 to 1990
1979 to 1980
1971 to 1978
1966 to 1970
1960 to 1965
1950 to 1960
Price History: 2000 to Present
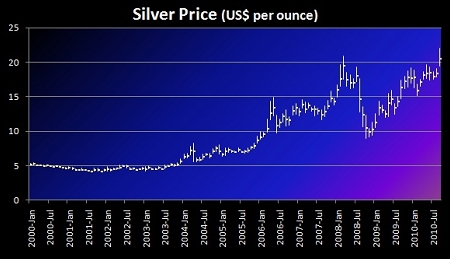 Silver prices remained under pressure for most of 2000, averaging $4.95 per troy ounce. The trading range did manage to increase marginally year-on-year, recording a high of $5.45 in February of 2000 and a low of $4.57 in December. The silver price softened throughout the year, largely because of continued Chinese government sales and ongoing private disinvestment.
In 2001, silver prices averaged $4.37 per troy ounce. The metal ended the year on a much-brighter note, with silver fixing at $4.52 on December 31, only 7 cents down from the year's first trading day.
In the face of an enduring global economic slowdown, the silver price demonstrated resilience in 2002. With an average price of $4.60 per ounce in 2002, silver recorded a 5-percent year-on-year increase over 2001. Silver retained its characteristics as a precious metal, rising in value during periods of crisis last year.
The average silver price in 2003 was $4.85 per ounce - a 5.4-percent increase over 2002. Much stronger investment interest and the improved fabrication demand scenario, which picked up strongly from the third-quarter onwards, propelled the silver price to $5.97 per ounce at year's end.
The silver price in 2004 staged a dramatic rally, rising a robust 36 percent to average $6.66 per ounce. This compared to an average price of $4.85 in 2003. This stunning price performance reflects fundamental changes in silver's supply/demand balance. Last year also saw a boom in investor activity, mainly driven by funds operating on futures exchanges and considerable buy side interest from high net-worth individuals.
In 2005, the silver price experienced a 10 percent increase over the average 2004 price of $6.65 per ounce, to an average of $7.31 per ounce.
In 2006, the silver price experienced a 58 percent increase over the average 2005 price of $7.31 per ounce. The silver price reached levels not seen in 26 years and was the leader when compared with gold (36 percent increase) and platinum (27 percent increase). The primary factor driving the stronger silver price was the continued strength of investment demand, which returned in earnest in 2005, was sustained in 2006. Much of the investment demand can be attributed to the successful launch of Barclays' Global Investors iShares Silver Trust Exchange Traded Fund (ETF), which was introduced in late April 2006.
The annual silver price, led by continued strong investor and industrial applications demand, averaged an impressive US$13.38 in 2007. This result represented a 16 percent price increase over 2006, and on a percentage basis was stronger than that enjoyed by gold, platinum and palladium last year. When looking at the 2007 silver price, the white metal posted a very solid performance to averages not seen since 1980. A key development in silver’s recent fortune has been the pronounced shift in investor behavior, witnessed by the continued presence of investors on the demand side of the equation since 2004.
During the first half of 2008, investors drove the silver price up above the US$20/oz mark (a high of US$20.92 oz was recorded in March) against a backdrop of generally firm fabrication demand. The second half of 2008 was a different story as the economic outlook deteriorated rapidly, and silver, as well as other metal prices, slumped. However, silver’s price in the first third of 2009 recovered a good part of the lost ground.
In 2008, a record inflow of over 93.1 Moz into the three main silver ETFs was instrumental in the high price average, as investors propelled silver to multidecade highs, in not only daily price terms but also in the annual average.
Coins and medals fabrication jumped by an astonishing 63 percent to a record of 64.9 Moz in 2008. The main reason for this was a surge in investment-related purchases of bullion coins, both in the United States and Europe. Notably, fabrication of the U.S. Silver Eagle bullion coin achieved a record 19.6 Moz last year, approximately double the 2007 figure, and would have been higher if the U.S. Mint had sufficient blanks to produce coins to meet demand. In 2009, physical silver investment demand has continued to increase, as the U.S. Mint has already achieved a nearly 70 percent year-on-year rise in the first quarter.
Silver posted an average price of $14.67 in 2009, the second highest average since the high reached in 1980. Strong gains in investment and a recovery in demand later in the year, were the prime reasons for the 53 percent intra-year rise.
Much of 2009’s strength in investment can be attributed to soaring demand for silver exchange traded funds (ETFs) as well as physical retail investment. This occurred on the heels of 2008’s previous record ETF inflow of 265.3 million ounces (Moz) of silver. Total ETF holdings rose by 132.5 Moz over the course of 2009, ending the year at an impressive 397.8 Moz as new funds entered the marketplace from Australia and the United States.
In 2009, coins and medals fabrication rose by an impressive 21 percent to post a new record of 78.7 Moz, driven by a jump in retail demand, principally in the United States, although western European demand was also stronger in 2009. In the United States, the increase in its bullion coin sales was also accompanied by a surge in bar demand. Of note, demand for the U.S. Silver Eagle bullion coin reached record highs in 2009, with over 28 million Eagles sold. To put last year’s performance into context, over the 1986-2008 period, U.S. Eagle minting averaged 7.7 Moz per year.
Price History: 1990 to 1999
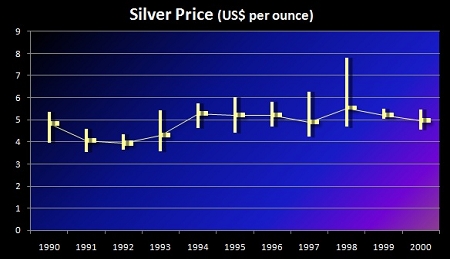 Throughout the 1990's, the main question for the silver market was the rate at which above-ground stocks of bullion and coins were being consumed by the widening gap between fabrication demand and conventional supply, and when this erosion of stocks might begin to significantly impact the price of the metal. Mine production of new silver rose by only 4 percent from 1990 to 1999, while total fabrication demand increased by 22 percent during the same period.
While the fundamentals for silver strengthened during the past decade, the price of silver slowly climbed from an average price of $4.83 in 1990 to an average price of $5.22 in 1999.
In 1999, silver's price performance was subdued following an eventful 1998, and was off 5.8 percent from the previous year, but it did finish the year up 6.7 percent from its starting level (ending the year at $5.33 having begun it at $4.99). It traded in a narrow range between $4.88 and $5.79.
Substantial flows of silver out of China helped to keep the price in check in 1999, and had similar impacts in the early 2000s.
The gold/silver ratio (the number of ounces of silver it takes to buy one ounce of gold) is another market indicator some analysts watch. This ratio has at times been a closely followed indicator of the relative trends in the two markets and in the past has been used by investors as signals for buying, selling, or exchanging gold and silver. The ratio for 1999 was 53.37, versus 53.08 in 1998. The average for the period 1968-1999 is 50.18.
Price History: 1981 to 1990
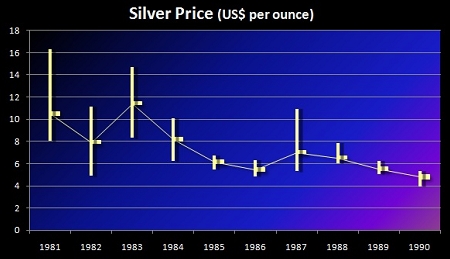 By the beginning of 1981 the silver market was starting to adjust after the traumatic events of 1980. Industrial silver demand was declining, both because of the worldwide recession that had set in, and in reaction to high silver prices. Investment demand for silver also fell sharply. Investors were aware of the reduced fabrication demand for silver, and of the amount of silver backed up at refineries Other investors had lost money in 1979-1980, and were wary of returning to the market. Still others were distracted from silver by more attractive financial markets.
Supply also fell, as the surge of old scrap and coin melt subsided. Total supply dropped 101.1 million ounces from 1980's level to 483.5 million ounces.
The worldwide recession persisted until late 1982, continuing to restrain fabrication demand and discourage investment absorption. Silver mine production, meanwhile, had begun to rise, as some mines developed in reaction to the higher prices since 1979 came onstream. Much mine output of silver remained profitable even as silver prices subsided to around $8.00 in the early 1980s, so that expanding existing operations and developing new mines remained an attractive proposition for many miners. Secondary recovery of silver, meanwhile, continued to decline.
Silver prices reached a cyclical nadir of $4.98 in June 1982, 10% of the $48 peak just 30 months earlier. June 1982 also proved to be the trough of the recession in the United States. During 1982 serious problems erupted in the international debt market, in particular relating to the debt repayment problems of certain countries in Eastern Europe and Latin America.
In late 1982 investor interest in silver was rekindled by several forces, all of which emerged at roughly the same time. The international financial market panic led some investors to turn to silver. Others were attracted by what they saw as unsustainably low prices. Investment demand also was encouraged by a rapid easing of credit market conditions by monetary authorities in most industrialized nations; this easing led to an immediate revival of inflation fears. As a result of all of these forces coming to bear at once, investment demand picked up during the second half of 1982 and the first quarter of 1983. This influx of investor buying helped take silver prices from the June 1982 low of $4.98 to a peak of $14.72 in March 1983.
In March 1983, several trends came into play reversing the rise in silver prices. First, the price had nearly tripled in nine months. Such a fast ascent led to profit-taking by investors; it also constricted industrial use. On the supply side, secondary recovery of silver from scrap and coinage increased in response to the higher prices. OPEC lowered its official benchmark oil price, for the first time in the cartel's history. The sudden decline in petroleum prices quickly reduced inflation expectations. Silver prices had averaged $13.96 in February 1983. In March they averaged $10.62.
Prices recovered slightly during the summer months, but from 1983 until 1986 the trend in prices was downward. This downward trend served an important purpose in the physical market, in that it discouraged new developments of primary silver mines, except where high ore grades or other factors made for extremely efficient plants. It also served to reduce secondary recovery of silver. On the demand side of the market, relatively low silver prices removed the incentives to using less silver or substituting away from silver in products.
Total fabrication demand fell sharply at the beginning of the 1980s, in response to higher silver prices, and worldwide recession. Longer term demographic and technological trends had been pointing to a decline in use, which the price rise and recession accelerated.
For example, silver use in sterlingware in the United States actually had peaked in the early 1970s, and was clearly going through a secular loss of markets due to changing demographics and consumer tastes. By 1979 U.S. sterlingware use of silver had fallen 55% from its 1973 peak of 29.3 million ounces. The decline that followed 1979 was a continuation of this longer term trend, exacerbated by the rise in silver prices and the economic recession.
Other industries, including the important photographic and electronics uses for silver, were able to reduce their per-unit silver requirements in some instances, and in other cases to substitute other materials for silver. As silver prices subsided later in the 1980s, some of these trends reversed. In the color film photographic market, for example, competition for higher film speeds led to an increase in per-unit silver use, to levels higher than those seen in the late 1970s.
Fabrication demand, including coinage, reached a low of 363.1 million ounces in 1981, the lowest level since 1960. During the early 1980s, fabrication demand remained weak, but in 1984 it began rising once more, stimulated by low silver prices and strong growth in industrial activity.
Silver supply followed a more erratic pattern during the 1980s, which partly reflected the high degree of price responsiveness of secondary recovery. Total supply fell 101.1 million ounces from 1980 to 1981. This decline was entirely a function of the scaling back of secondary recovery, after the rush of material in late 1979 and 1980. Total supply continued to slump in 1982, falling to 455.1 million ounces. While this was happening, in late 1982, silver prices staged a rally from $4.98 to nearly $15.00. This surge in prices brought out significant quantities of scrap in 1983, which boosted total supply to 531.1 million ounces. As prices decreased from early 1983 into 1986, total supply once more fell back, to 449.7 million ounces in 1986. Mine production was restricted by the low prices at this time, with silver reaching a low for this period of $4.85 in May 1986. Secondary recovery also was constricted by these low prices. Since 1986 total supply rose once again, reaching 514.0 million ounces in 1990.
Since 1979 there was a surplus of total silver supply over fabrication demand every year. On a cumulative basis, this surplus totaled 927 million ounces from 1979 through 1990.
It appears that most of this surplus was bought by bona fide investors, individuals who have accumulated these silver positions in the expectation of being able to liquidate them at some later date at a profit. Minor surpluses and deficits can be accounted for by changes in reported market inventories and investor coin purchases. Most of the silver coins produced in this decade were bullion coins, designed for investors and collectors and not intended by their mints for use as circulating currencies. Silver coinage since 1979 totaled 241.6 million ounces.
Accounting for these factors, it still seems that investors acquired around a billion ounces of silver since the late 1970s, one quarter of this in coins. The period of heaviest silver purchases occurred in 1980 and 1981. Simple logic bears this out: Strong investment demand was keeping prices high at this time. As investor buying waned later in the decade, prices slipped down. The weighted average acquisition cost of the silver added to investor inventories during this past past decade was $11.25 per ounce.
Price History: 1979 to 1980
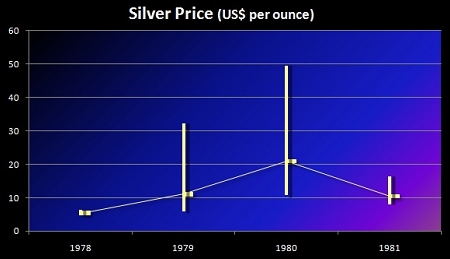 By 1979, investors and other market participants had come to the strong conviction that the silver market was facing a severe shortage of metal, and that prices were likely to rise sharply at some point. The market had been living off of investor selling for seven years. Prices had risen from the beginning of the decade, but there were serious questions as to how much longer investors would be willing and able to continue supplying silver to fabricators, at least at the prices seen in the mid-1970s.
World economic and political events also were coming to bear on the silver market, most notably in the form of a major cyclical upward surge in inflation throughout the industrialized world. Sensing that silver prices should be adjusting upward to compensate for these inflationary trends, many investors decided that silver prices between $4.00 and $5.50, which had prevailed during most of the late 1970s, were too low. Investors ceased selling their old silver holdings, and instead began adding to their holdings. This added further upward pressure to the price of silver. Simplistic retrospectives of the silver market in late 1979 tend to focus on the high-profile purchases of large amounts of silver and silver futures by various wealthy individuals; in reality, there was a tremendously broad-based rush to buy silver by investors worldwide at the time.
By the final quarter of 1979, silver prices had risen to levels between $15.00 and $25.00 per ounce. At these levels several physical market forces combined to act against higher prices. Additionally, the two major U.S. futures exchanges that traded silver at the time took steps to force those with margined long positions to liquidate their positions.
As silver prices rose above $15.00 in September 1979, fabrication demand began to be affected. On an annual average basis, industrial silver use fell a relatively mild 0.9 percent to 445.1 million ounces in 1979. Demand had held up reasonably well during the first three quarters of the year. However, a sharp cut-back in demand in the fourth quarter led to overall annual decreases in silver use. By some estimates, industrial use of silver was 40 percent lower in the last quarter of 1979 than it had been in the first quarter of that year.
When silver prices rose sharply in 1973-1974, manufacturers began searching for ways to reduce their need to use silver. Several substitutes for silver and methods to reduce per-unit silver use were developed, but they were too expensive to implement as long as silver was around $5.00 per ounce. When silver rose to $15.00 and more however, fabricators were able to introduce these measures rapidly. Demand also quickly declined for jewelry and sterlingware.
Investors began to sell large amounts of silver especially old coins from the 1960s. Other sold large amounts of sterlingware and jewelry for its silver content.
A host of political events, including the continuous U.S. hostage crisis in Iran and the Soviet invasion of Afghanistan, motivated investment demand, helping keep silver prices high and volatile through 1980. High inflation, high nominal interest rates, and negative real interest rates further stimulated investor interest in silver and other tangible assets. Prices dropped as low as $10.80 in March, but rose back to $25.00 in September, as the Iran-Iraq war erupted. By the end of 1980 silver prices had subsided once more to around $16.00.
These high silver prices meanwhile were having a dramatic effect on the physical silver market conditions. Total supply rose form 434.8 million ounces in 1978 to 505.0 million ounces in 1979, and then to 584.6 million ounces in 1980. The bulk of this increase occurred in secondary recovery. Total secondary recycling of silver doubled, from 152.0 million ounces in 1978 to 302.0 million ounces in 1980. The recovery of silver from old coins, those holdings taken in by investors during the 1960s, increased from 21 million ounces in 1978 to 45 million ounces the next year, and then to 94 million ounces in 1980. Refiners faced substantial backlogs, sometimes of 6-12 months in processing these materials.
Mine production remained almost unchanged during this time, and actually was lower in 1980, at 264.6 million ounces, than it had been in 1978. (A U.S. copper industry strike, along with a strike at a major U.S. silver mine, were major factors behind the low output.) Mine developments have long lead times, and the increases in output that came about in response to the 1979-1980 jump in silver prices did not appear until the mid-1980s.
Prices also were having a dramatic effect on fabrication demand, compounded in 1980 by the onset of the deepest post-war recession. Industrial silver use fell from 449.1 million ounces in 1978 to 362.5 million ounces in 1980, a level fully 25 percent below the 1976 cyclical peak of 481.0 million ounces. The last countries using silver in circulating coinage, Austria, France and West Germany, withdrew from that activity, reducing silver use in coinage on a worldwide basis from 39.5 million ounces in 1978 to 15.0 million ounces in 1980.
The combination of higher secondary recovery and lower fabrication demand brought an abrupt end to the eight years of silver market supply deficits. In 1978 new supply had fallen 53.8 million ounces short of fabrication requirements. In 1979 there was a 28.9 million ounce surplus.
In 1980 this surplus reached 207.1 million ounces, nearly as high as the 228.9 million ounce surplus that had resulted from the 1968 run-up in silver prices and the Treasury’s sales programs. The increase in the recovery of silver from old coins accounted for nearly half of the surplus.
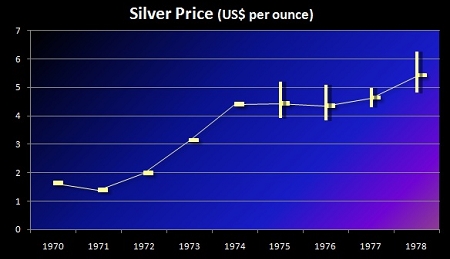
Price History: 1971 to 1978
 By 1971 U.S. government stocks had fallen from their 1959 peak of 2.1 billion ounces to around 170 million ounces. The U.S. government had removed silver entirely from its currency, and ceased to intervene in the silver market. Total silver supplies had reached a record 747.4 million ounces in 1965, of which 54 percent, or 400 million ounces, came from the U.S. Treasury. From that point onward, the Treasury was backing out of the silver market, and total supply declined steadily, and never has approached that 1965 record again.
Total silver supplies had declined to 381.3 million ounces by 1971, their lowest level since 1960. New mine production accounted for 65 percent of this total, or 247.3 million ounces. Secondary and other supplies totaled 134.0 million ounces. Throughout the 1970s, mine production remained rather static, fluctuating between 236.6 million ounces in 1974 and 272.0 million ounces in 1979. Secondary supply rose from 1972 to 1974, in line with silver prices, and then fell back to 152.0 million ounces in 1978.
Fabricating demand rose sharply in the early 1970s, from 414.4 million ounces in 1971 to 545.0 million ounces in 1973. Demand then dropped for two years, as a worldwide recession reduced consumer demand for silver-using end products and as higher silver prices led to some reductions in silver use. Demand fell to 497.9 million ounces in 1974 and 437.9 million ounces in 1975. Use rebounded the next year, to 511.0 million ounces, before stabilizing between 488.6 million ounces and 491.3 million ounces in 1977 and 1978.
Total new silver supplies fell far short of meeting these requirements. From 1971 through 1978 there was a cumulative deficit of new supply over demand of 415.8 million ounces. The silver that filled this gap came from the 620.5 million ounces of silver inventories – many held by investors – built up during the previous seven years. By becoming net sellers of silver, investors replaced the U.S. Treasury as the source of silver to make up for a major, ongoing shortage of silver. The difference was that in the early 1960s the U.S. Treasury had sold at a fixed price because it was acting to restrain silver prices. In contrast, investors wanted increasingly higher prices for this service. The weighted average price of the investor silver sales from 1971 through 1978 was $3.21, 71 percent higher than the price they had paid for this metal in the late 1960s. The average price of silver was $1.55 in 1971. The average price rose to $4.71 in 1974, and then spent the next four years between $4.35 and $5.40.
Price History: 1966 to 1970
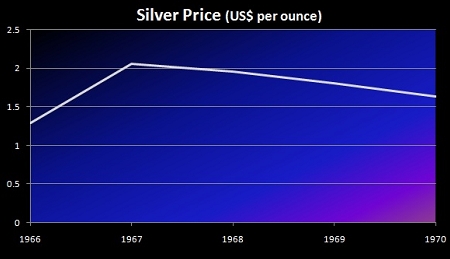 By 1966 the Treasury’s program of eliminating silver from coinage was in place. The Treasury continued to use some silver in coins from then until 1969, but the annual average during these four years was 38.5 million ounces, down from 178 million ounces per year on average during the previous four years. Austria, France, and West Germany continued to use silver in some circulating coins until the late 1970s.
The U.S. government also continued to sell silver bullion. From 1966 through November 1970, 674 million ounces of bullion were sold. (In 1967 the bullion sales program was transferred from the Treasury to the General Services Administration. Ownership of the bulk of the remaining silver were transferred from the Treasury stocks to the National Defense Stockpile.)
Industrial demand meanwhile remained strong, although there was a period of weakness in the mid-1960s. The higher silver prices had some limiting effect on use, although the major factor was slowing overall economic growth and a shift in the economy away from the manufacture of goods that used silver. Industrial use peaked in 1966 at 414.9 million ounces. It declined 10 percent over the next two years, before stabilizing between 372 and 387 million ounces on an annual basis in the late 1960s and early 1970s.
Investors remained keenly interested in silver, absorbing around 620.5 million ounces of silver from 1964 through 1970. Interestingly, the price of silver rose from $1.29 to a peak of $2.57 in 1968, before falling back. The rise and fall in silver prices was coincidental with the volume of these investor purchases: As investor demand decreased over the next three years, prices softened commensurately.
The weighted average price paid in these investor acquisitions, using annual average prices, was $1.88 per ounce. This figure will be important in understanding the next phase of the silver market, from 1971 into 1979, when the new supply of silver fell short of industrial requirements and the resulting deficit was accommodated by investor selling.
While investor demand was strong and industrial demand remained at healthy levels, Mine production rose at a 3.4 percent per annum rate, from 218.4 million ounces in 1965 to 258.5 million ounces in 1970. (Actually, mine output of silver was not as vibrant as these figures suggest, since 1965 was a year of stable output and 1970 represented a cyclical peak in silver production. Output fell back the following year, and did not regain its 1970 level until 1977.) Secondary supply also continued to expand, in part due to the rise in silver prices, which made recycling much more attractive. Bloated by continued U.S. government sales, total supply remained high throughout this period.
Price History: 1960 to 1965
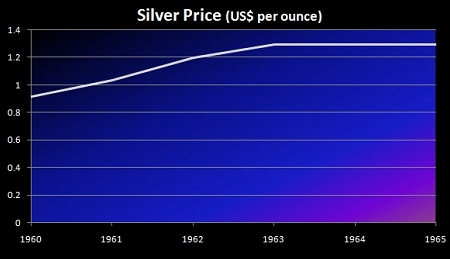 For decades, the Treasury had been a net buyer of silver. By 1960, it had become a net seller. In 1960, the Treasury sold 22 million ounces of silver in bullion form, and used another 46 million ounces in coinage. The next year the Treasury had to sell 63 million ounces of bullion and use another 56 million ounces to replace silver coins that had been taken out of circulation by investors. That year, 1961, the Treasury realized that it would run out of silver for use in coinage and as a reserve against silver certificates unless it took drastic measures to begin phasing silver out of currency. In 1961, the Treasury ordered $5 and $10 silver certificates out of circulation, freeing silver reserves held against these bills and reducing the public’s call on Treasury silver. In November 1961 the government also suspended silver bullion sales by the Treasury at the formerly fixed price of 91 cents.
Once the Treasury stopped selling at that price, market quotes for silver quickly rose. In June 1963 the Treasury also replaced the $1 silver certificate with Federal Reserve notes. By 1963, silver prices reached $1.29, the monetary value of silver in coinage. At prices above this level, holders of silver certificates would have been able to redeem them for more valuable silver, under the now-defunct silver certificate legislation. (The other trigger price the Treasury worried about was $1.38, at which level it was profitable to recycle coinage for its silver content.)
During this transition period, the U.S. Treasury still had to keep the silver market well supplied, in order to keep the silver market relatively calm until it had completed the withdrawal of silver form its currency. In late 1963 the Treasury resumed its silver bullion sales, as part of this effort. Over the six years between 1960 and 1965, the Treasury sold a total of 342 million ounces of silver bullion. It used another 814 million ounces of silver in coinage during this same time. In total, the Treasury used 1,156,000,000 ounces of its silver reserves. Much of this silver, especially the bulk of it used in coins, found its way quickly into the hands of investors. Government steps to remove silver from the currency led investors to conclude that the price of silver would rise sharply once the Treasury no longer was supplying the market with such large volumes of the metal.
Fabrication demand continued to rise sharply. Industrial use, excluding coinage, rose at a 9 percent per annum pace, from 212.9 million ounces in 1959 to 355.8 million ounces in 1965. Including coinage, which grew rapidly during this same time due to the investor run on coins, total fabrication demand rose 16% per annum. Mine production, in contrast rose only 1.9% per year from 195.6 million ounces in 1959 to 218.4 million ounces in 1965.
Secondary recovery of silver was starting to expand, in part spurred by the realization that with the passing of Treasury silver sales and coinage programs the market would need to recover increasing amounts of silver from scrapped items. It was clear to market participants that silver prices had been restrained by the Treasury’s willingness to fill the gap between market supplies and industrial demand, and that once the Treasury’s silver was gone, additional supplies would have to be found elsewhere. Coin melt rose from 10 million ounces in 1960 to 30 million ounces in 1965. Silver recycling from other items rose from 40 million ounces in 1960 to 57 million ounces in 1965.
Price History: 1950 to 1960
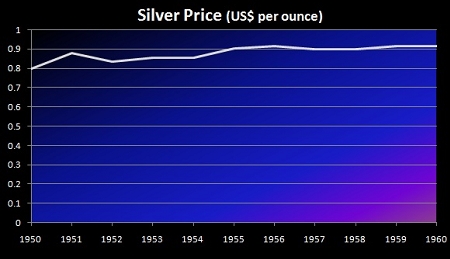 From the end of World War II until the early 1960s, fabrication demand for silver rose strongly. This period witnessed the rebuilding of Europe and Japan, and a tremendous push worldwide toward electrification, housing construction, and consumer durables. Many electrical appliances, as well as electrical generation and transmission systems, use silver, which was one of the major factors behind this extended boom in industrial silver usage. At least as important was the advent of mass market photographic products, which sharply increased the use of silver in photographic films and papers.
There was another reason why fabricators were eagerly turning to silver during this period. The U.S. Treasury had a silver inventory that, as of 1950, stood at 2 billion ounces. Furthermore, Treasury policy was to buy domestically mined silver at 90.5 cents per ounce and sell silver at 91 cents, effectively putting a cap on the United States market price of silver.
In this way, the U.S. Treasury was the buyer or seller of last resort in the silver market, by virtue of the Silver Purchase Act of 1934 (itself one of a series of such laws extending back to the 1870s). The 1934 law authorized the Treasury to buy silver either until:
- the market price reached $1.29 (the monetary value of silver) or
- the monetary value of Treasury silver stocks reached one-third of the monetary value of the Treasury’s gold stocks
This purchase program remained in effect, in essence, until 1961. During the intervening 28 years, the Treasury acquired 3.2 billion ounces of silver. About half was acquired in the first four years, from 1934 through 1937, and the other half between 1937 and 1955.
A good portion of this silver was acquired from U.S. mines: 880 million ounces, or nearly all domestic production from 1937 to 1955. About 110 million ounces were purchased during the first three months following passage of this legislation in 1934. The law prohibited Americans from owning non-monetary silver, and directed them to sell it to the Treasury. A great deal of silver was also imported. Between 1934 and 1939, nearly 2 billion ounces of silver came from other countries. Market prices ranged between 25 cents and the ceiling created by the Treasury’s set price of 90.5 cents during these years, but spent most of the time below 75 cents. U.S. fabrication demand (excluding coinage), which totaled 1.8 billion ounces from 1935 through 1955, was met by imported silver.
By 1955, the demand for silver was great enough to push market prices above the Treasury’s 90.5 cents purchase price. Since the Treasury was a seller at 91 cents, the price remained around this level for several more years, as the Treasury’s reserves were depleted. While the 1934 law directed the Treasury to buy silver with an eye on boosting the silver price to $1.29, the Treasury’s policy during the late 1950s was designed to keep silver prices below the point at which coins would be melted down, to allow time for the Treasury to extricate itself from the silver market.
Treasury reserves peaked in 1959, when the U.S. Treasury had 2,060,000,000 ounces on hand, and another 1,331,000,000 ounces were outside the Treasury in circulating coinage, for a total of 3,391,000,000 ounces.
In summary, the post-war period saw silver demand rise sharply, while mine production and other supplies were relatively stable. The U.S. Treasury sold tremendous amounts of stockpiled silver during the years after 1955, in order to keep the price of silver below its "monetary value." Additionally, the actual growth of the overall economy increased the need for circulating coinage. One reason for the Treasury’s sales was straightforward: if silver’s market value rose above its monetary value, $1.29 per ounce, holders of U.S. silver certificates, one form of currency in circulation at the time, could trade in these $1, $5, and $10 bills in exchange for silver bullion. Also, there would be an enormous incentive for individuals to melt down the silver coins in circulation.
Had the Treasury not been present as a seller of silver, market supplies from other sources would have been hard pressed to keep pace with the growth of fabrication demand, and the price of silver most likely would have risen sharply during the late 1950s and early 1960s.