Top
Top Site Map
 References
 Link
Link About Me
 日本語サイト
Supply and Demand of Silver
Supply
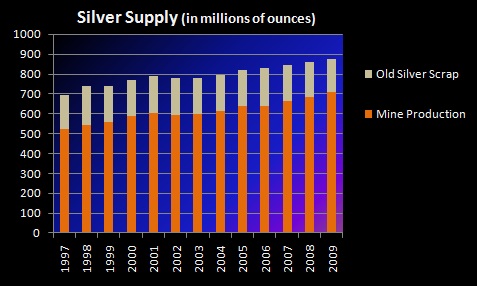
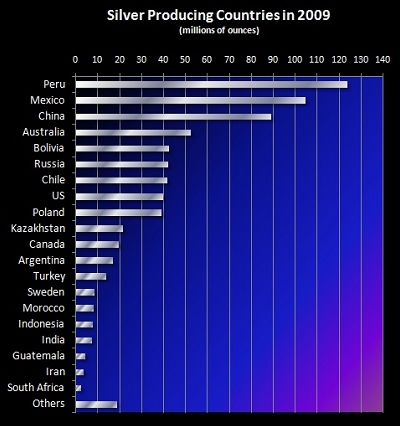 Silver mine production rose by 4 percent to 709.6 Moz in 2009. Gains came both from primary silver mines and as a by-product of gold mining.
Regionally, the strongest growth stemmed from Latin America, where silver output increased by 8 percent, with the most visible gains recorded in Argentina and Bolivia. Peru was the world’s largest silver producing country in 2009, followed by Mexico, China, Australia and Bolivia. All of these countries saw increases last year except for Australia, where output from the lead/zinc sector declined markedly.
Global primary silver supply recorded a 7 percent increase to account for 30 percent of total mine production in 2009. Primary silver mine cash costs remained relatively stable year-on-year, rising by less than 1 percent to $5.23/oz.
Net silver supply from above-ground stocks dropped by 86 percent to 20.2 Moz in 2009, driven mostly by the surge in net investment, higher de-hedging, lower government sales and a drop in scrap supply.
With respect to scrap supply, 2009 saw a 6 percent decrease over 2008’s figure to a 13-year low of 165.7 Moz. This represented the third consecutive year of losses in the scrap category.
Government stocks of silver are estimated to have fallen by 13.7 Moz over the course of last year, to reach their lowest levels in more than a decade. Russia again accounted for the bulk of government sales, with China and India essentially absent from the market in 2009. Regarding China, GFMS states that after years of heavy sales, its silver stocks have been reduced significantly.
Demand
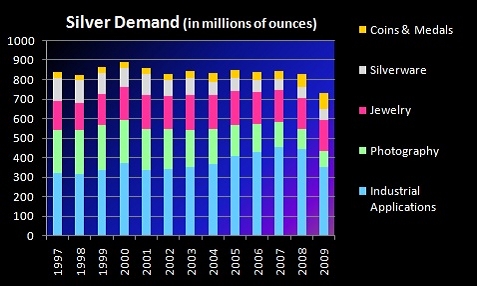 The bulk of the 11.9 percent decrease in 2009's total fabrication demand was primarily driven by the global financial crises, reflected mostly in a sharp drop in industrial offtake, to its lowest level since 2003. Total fabrication demand totaled 729.8 Moz and industrial demand posted 352.2 Moz in consumption.
Significant inventory cuts in the industrial supply pipeline, combined with a protracted decline in end-user orders, for example from a far weaker automotive industry, were the primary reason for lower industrial demand last year. While demand was noticeably weaker in the first quarter of 2009, it gradually improved as the year progressed. Overall, the losses were concentrated in East Asia, North America and Europe.
While overall jewelry demand dipped slightly by only 1.1 percent in 2009 to 156.6 Moz, India and China posted increases in jewelry demand last year, offsetting losses in most other markets.
Silverware demand reversed the trend of the last decade rising by a respectable 4.6 percent to 59.5 Moz, largely due to a surge in Indian fabrication.
Investment, De-hedging and Government Purchase
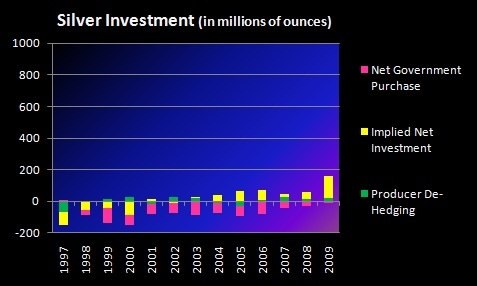 Implied net silver investment increased by a staggering 184 percent to 136.9 Moz in 2009, recording its highest level in the past 20 years.
Net silver supply from above-ground stocks dropped by 86 percent to 20.2 Moz in 2009, driven mostly by the surge in net investment, higher de-hedging, lower government sales and a drop in scrap supply. With respect to scrap supply, 2009 saw a 6 percent decrease over 2008's figure to a 13-year low of 165.7 Moz. This represented the third consecutive year of losses in the scrap category.
Government stocks of silver are estimated to have fallen by 13.7 Moz over the course in 2009, to reach their lowest levels in more than a decade. Russia again accounted for the bulk of government sales, with China and India essentially absent from the market in 2009. Regarding China, GFMS states that after years of heavy sales, its silver stocks have been reduced significantly.
Investment, De-hedging and Government Purchase
Implied net silver investment increased by a staggering 184 percent to 136.9 Moz in 2009, recording its highest level in the past 20 years.
Net silver supply from above-ground stocks dropped by 86 percent to 20.2 Moz in 2009, driven mostly by the surge in net investment, higher de-hedging, lower government sales and a drop in scrap supply. With respect to scrap supply, 2009 saw a 6 percent decrease over 2008's figure to a 13-year low of 165.7 Moz. This represented the third consecutive year of losses in the scrap category.
Government stocks of silver are estimated to have fallen by 13.7 Moz over the course in 2009, to reach their lowest levels in more than a decade. Russia again accounted for the bulk of government sales, with China and India essentially absent from the market in 2009. Regarding China, GFMS states that after years of heavy sales, its silver stocks have been reduced significantly.
- Silver investment demand has seen the same support from events driving gold investment, namely: US$ devaluation, the sovereign debt crisis in Europe, inflation fears, ultra-low interest rates and the further growth in commodities as an asset class.
- Copper an influence, with silver also regarded as an ‘industrial metal’ benefiting from economic recovery and fast growth in developing countries such as China.
- For some, silver is a more ‘economical’ alternative to gold (55xlower unit price).
- Silver's greater volatility and trading range than gold makes it attractive to certain investors.
- Some investors eyeing all-time high of nearly $50 per ounce.
- Small market size – value of total supply forecast at less than $19bn in 2010 compared to $170bn for gold – means silver price is very highly geared to growth in investor inflows.